Create, Manage and Monitor Network Connectivity
Network Connectivity Monitoring is a core feature of EdgeIQ Symphony's Device Management capabilities to monitor and troubleshoot the network performance of your IoT devices.
Network Connectivity Monitoring
EdgeIQ Symphony provides comprehensive network connectivity monitoring capabilities for IoT devices, allowing organizations to track, analyze, and optimize their device network performance across multiple interfaces and connection types.
Overview
The network connectivity monitoring feature helps you:
- Monitor multiple network interfaces (cellular, WiFi, ethernet) per device
- Track key performance metrics like latency, jitter, and throughput
- Identify connectivity issues proactively
- Configure automated latency and performance tests
Network Interface Types
EdgeIQ Symphony supports monitoring of various network interface types including:
- WWAN (Cellular) - 4G/5G cellular connections
- WiFi - Wireless network connections
- Ethernet - Wired network connections
- Virtual Interfaces - Virtual network bridges
Monitoring Capabilities
Connection Status

Connection Status of an online and connected device with 6 reconnects over the last 7 days.

Offline device showing a lost connection and 24 reconnects.
Devices running EdgeIQ Coda will display three distinct connection status indicators next to the device name:
- Heartbeat Status: The heartbeat status indicates, if heartbeats have been send on a regular basis by the device according to the configured heartbeat frequency. Possible states are
Never Reported,Online,At Risk, andOffline. When a heartbeat is received, devices will switch toOnline. After two or more missed heartbeats, a device will becomeAt Risk. After four or more missed heartbeats, a device is consideredOffline. - Connection Status: In addition to the configurable heartbeat status, the Connection Status depends on an active connection to the MQTT broker and switches immediately to
Offline(red) when the connection is lost. - Disconnect Events: Next to Connection Status, a counter shows the number of Disconnect events over the last 7 days. Monitoring Disconnect Events can help you identify devices with unstable network connections.
- Last Seen: If a device has been offline, an indicator next to the Disconnect Event Counter shows how long the device has been offline.
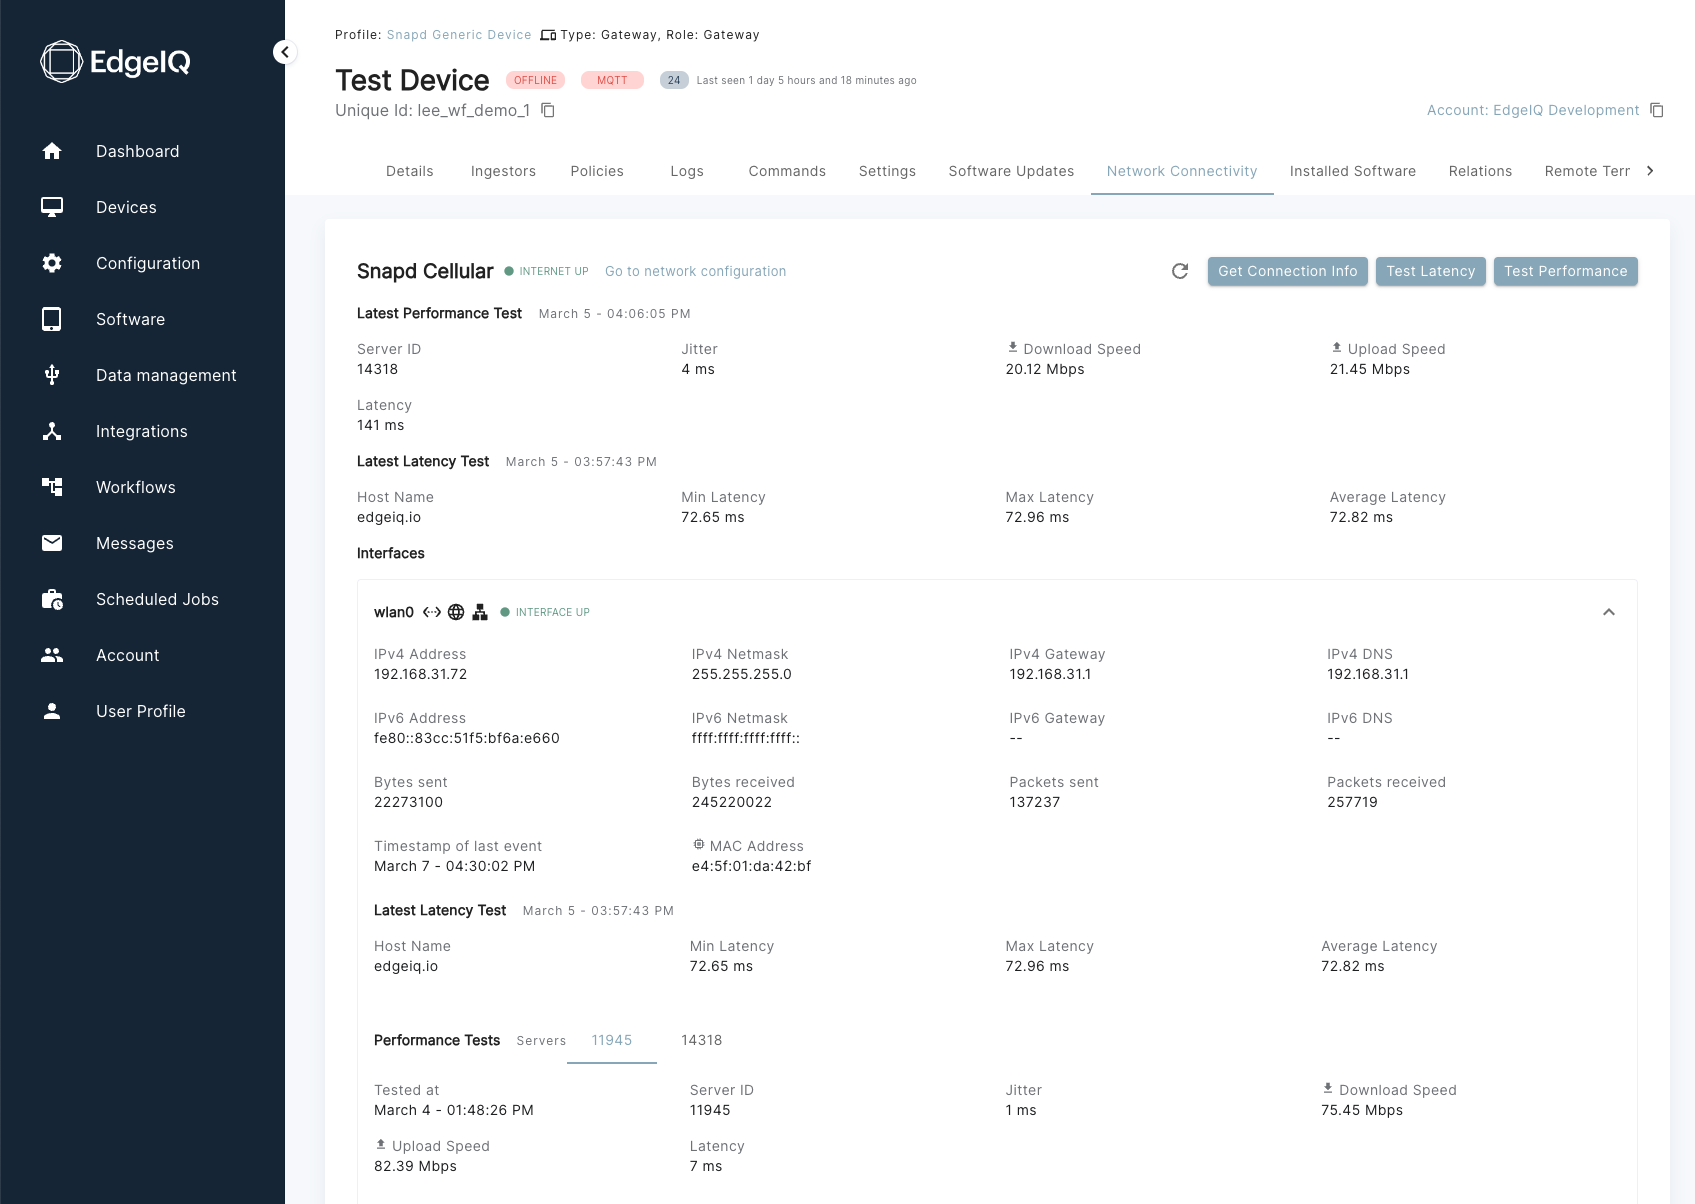
Network Interface Information

Network Interface Information displayed in the Network Connectivity section.
For each network interface, EdgeIQ Symphony collects and displays:
- Interface name and type
- IP addressing information
- Internet and Link Connection status
- Signal strength, connectivity mode, and provider info for cellular interfaces
- Hardware information (MAC address)
Performance Metrics
The platform measures and tracks key performance indicators:
-
Latency
- Minimum, maximum, and average response times
- Packet loss percentage
- Round-trip time (RTT)
-
Network Performance
- Download speed (Mbps)
- Upload speed (Mbps)
- Jitter (ms)
- Connection stability
Configuration
Network Interface NamingWhen configuring network interfaces, make sure to use the correct corresponding linux interface name as found on the device, for example
wwan0for cellular devices orwlan0for wireless devices. The naming convention depends on the operating system and version, for example ethernet interfaces can be namedeth0orenp0s5depending on the Linux distribution.To find the correct interface name, either use
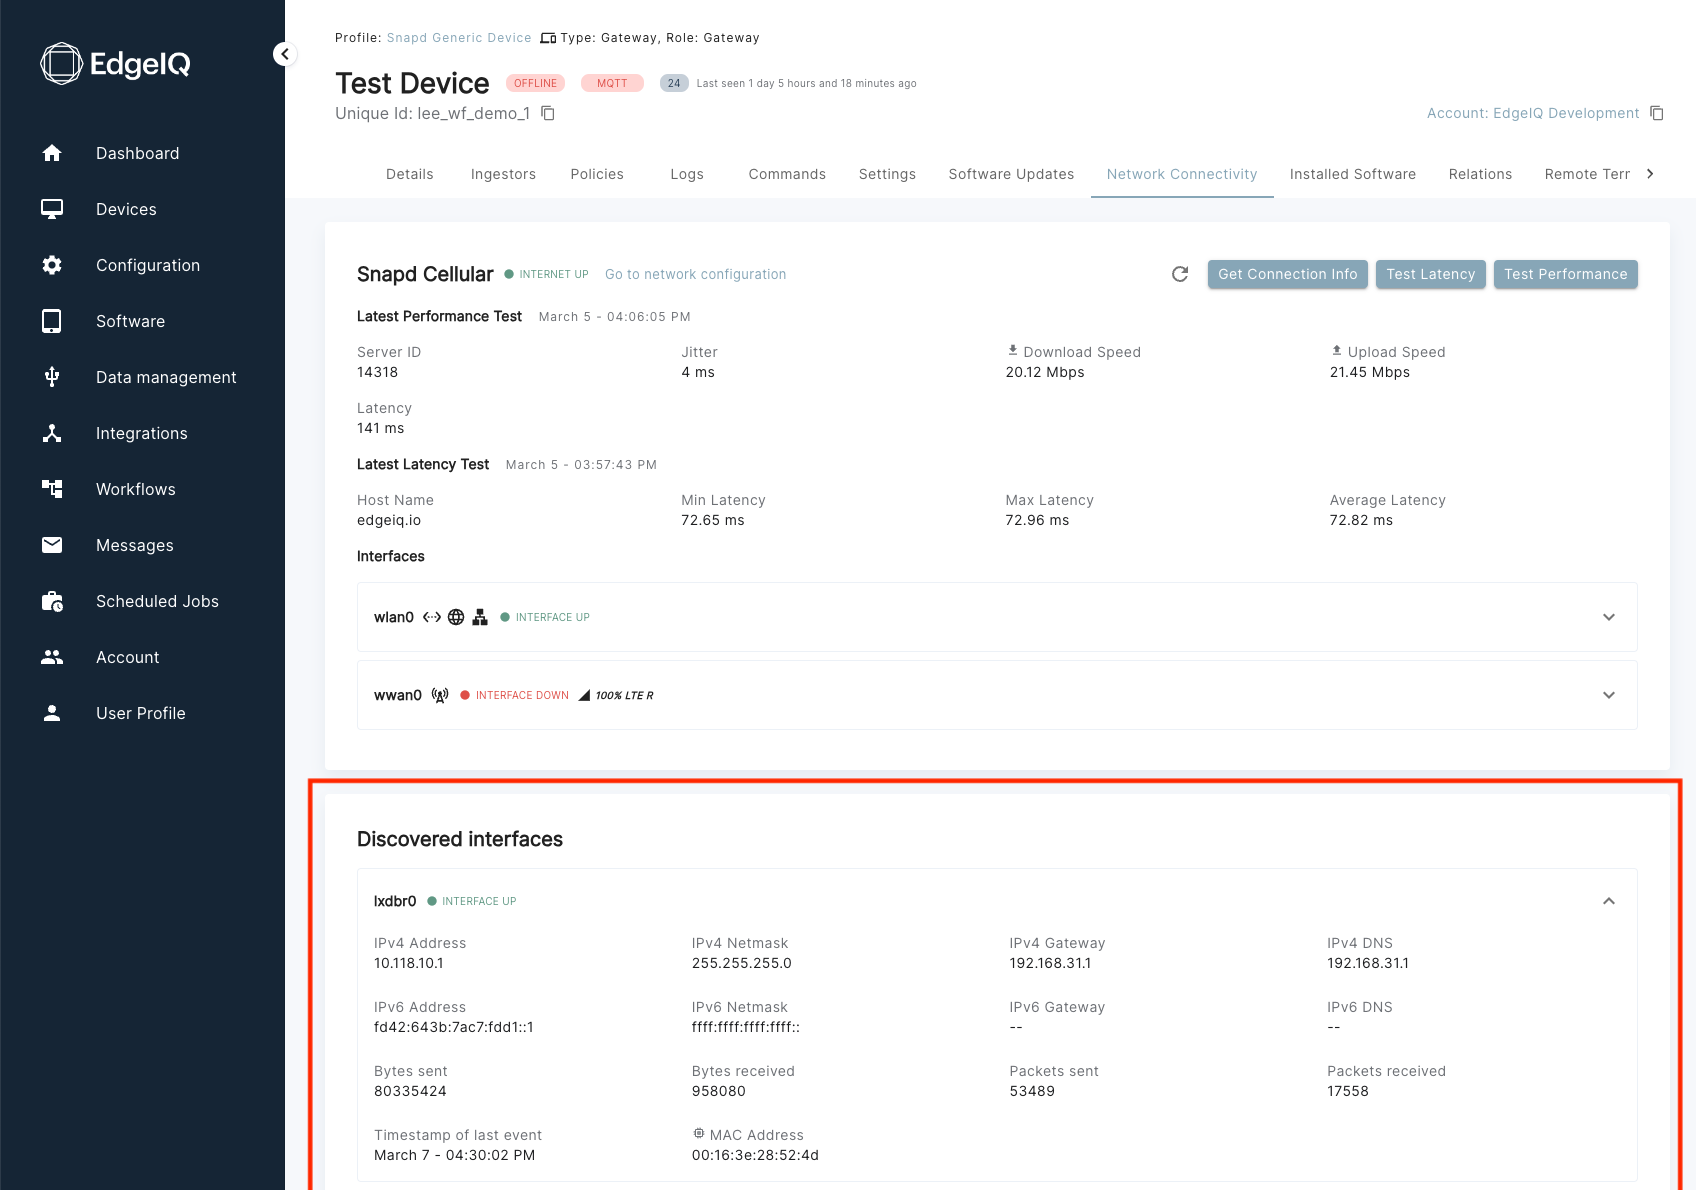
ifconfigorip linkon the device, or use the Discovered Interfaces feature within EdgeIQ Symphony to see additional network interfaces.

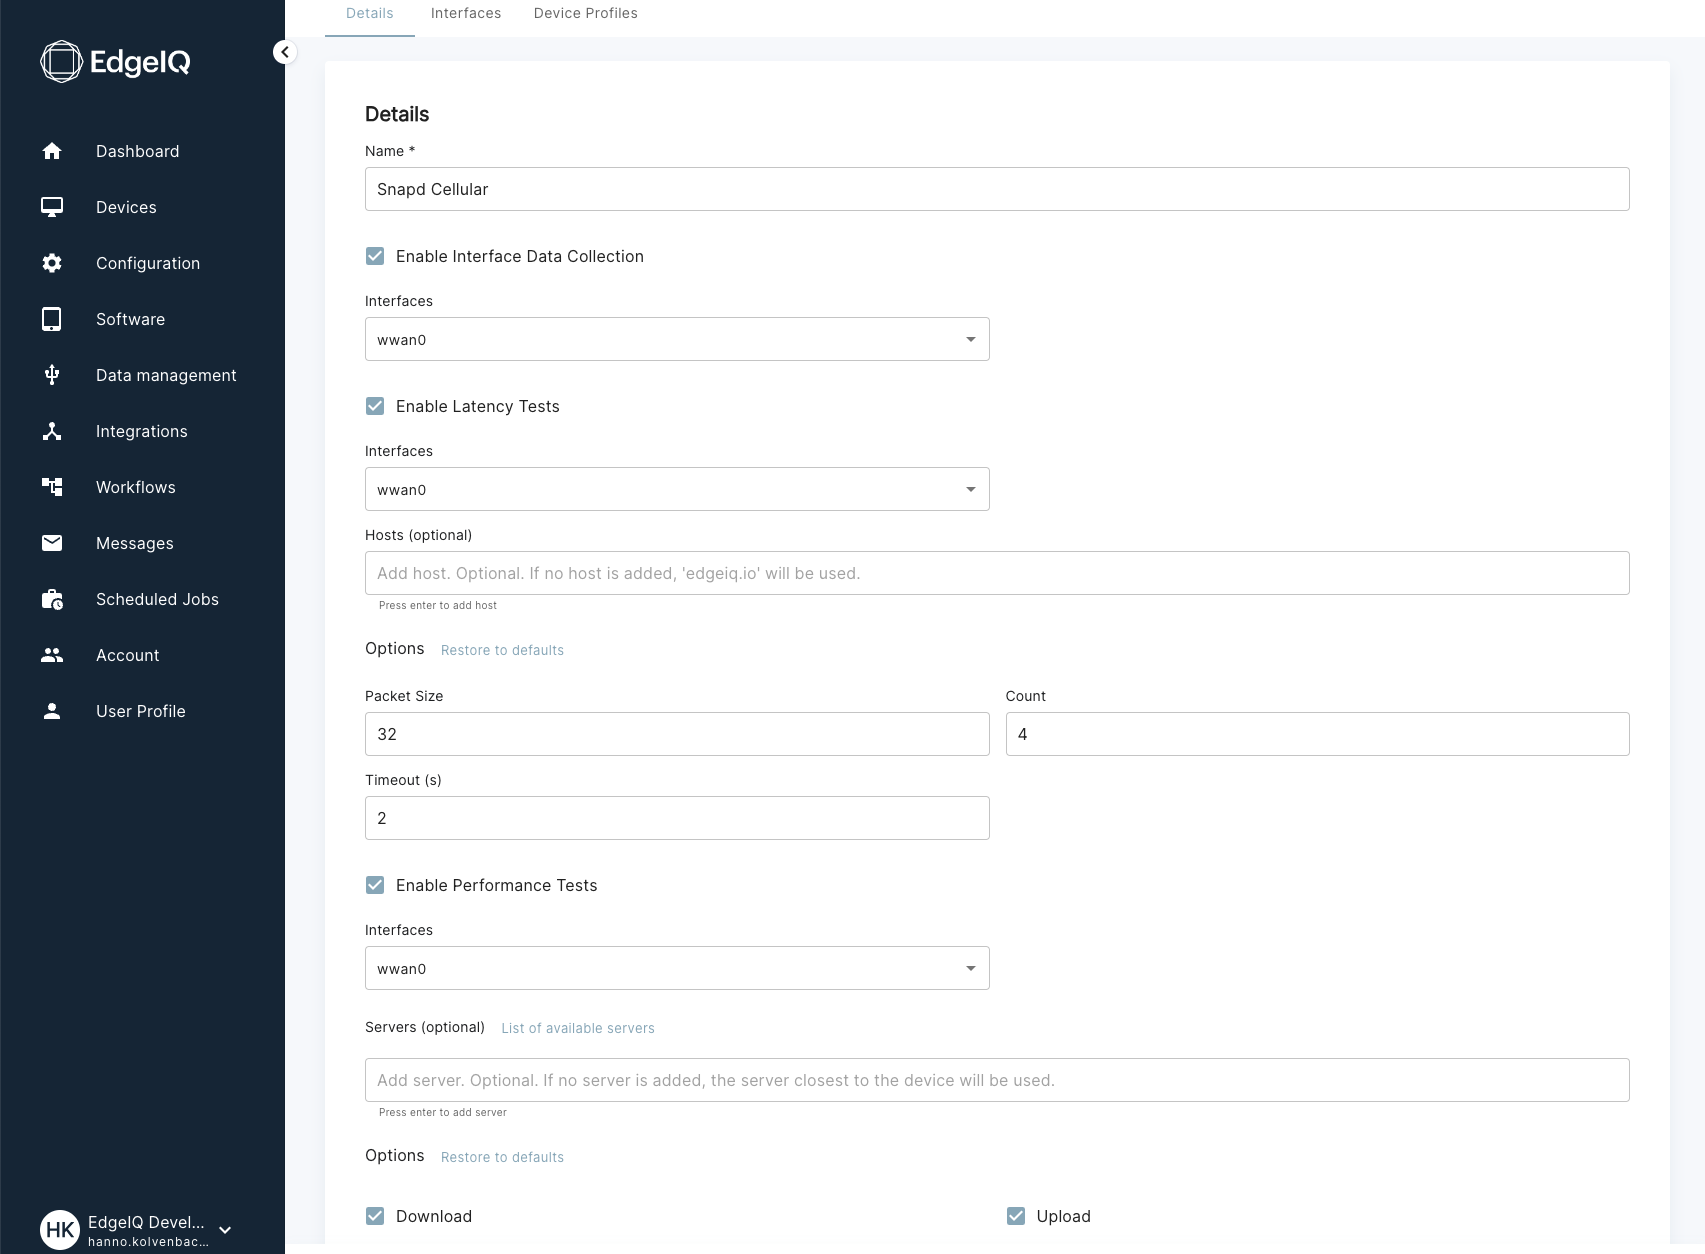
Configuration options for Interface Data Collection, Latency, and Performance Tests.

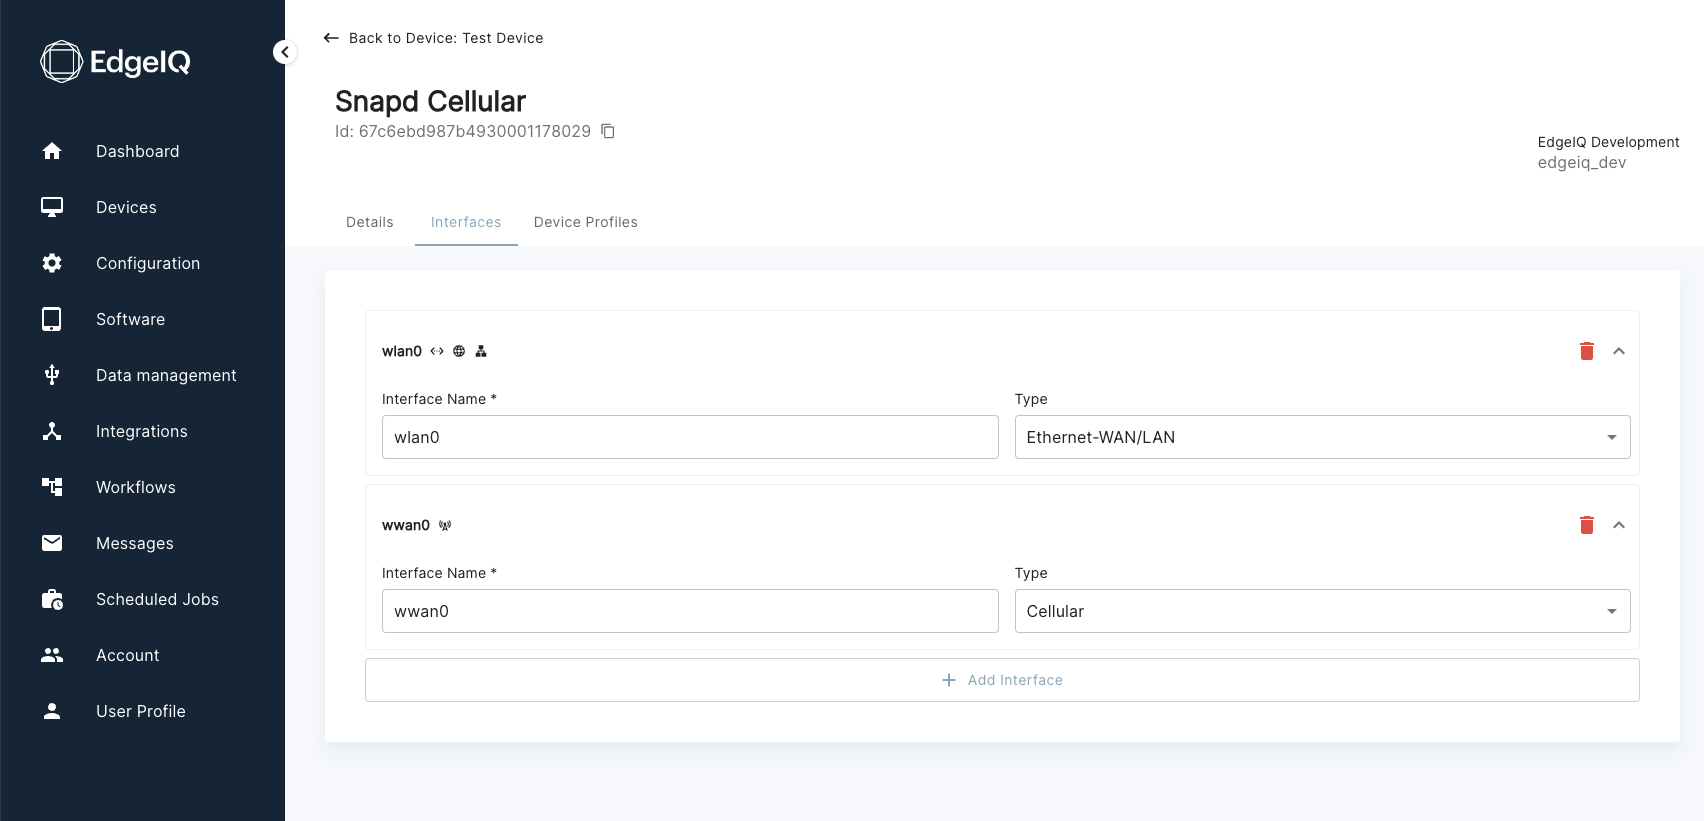
Network interface configuration.
You can configure automated network performance tests within the network configuration associated with a device profile:
- Interface Monitoring
- Configure network interfaces to be monitored
- Configure interface type
- Latency Tests
- Configure latency tests
- Define target hosts to test against
- Performance Tests
- Configure performance tests
- Select test servers
Discovered Interfaces

Network interfaces that have not been described in the network configuration are visible in the Discovered Interfaces section. Having access to this information is helpful when onboarding new devices and the naming of interfaces is not obvious. After adding an interface name found as a Discovered Interface to the Network Configuration, it will appear in the top section of the Network Connectivity Page.
Integration
The network connectivity monitoring feature integrates with other EdgeIQ Symphony components. Scheduled Jobs can be used to trigger performance and latency tests on a schedule to collect historic data.
The data collected through Network Connectivity monitoring can be used to perform further actions through EdgeIQ Symphony workflows, for example:
- Triggering alerts and sending notifications
- Performing remediation actions executed through commands, for example, restarting a cellular modem
- Update external systems
This allows for comprehensive device operations management and automated response to network issues.
API Access
All network connectivity data is available through RESTful APIs:
Endpoints
-
/devices/{id}/network_connectivity/latest- Get consolidated network information for a specific device
- Returns comprehensive view of all interfaces and their status
-
/network_latency_reports- Retrieve detailed latency test results
- Filter by device, interface, time range
-
/network_performance_reports- Access speed test and performance data
- Filter by various metrics (speed, jitter, packet loss)
-
/network_interfaces_reports- Get detailed interface configuration and status
- Track interface changes over time
Updated 8 months ago